Measurabl Intelligence
Introducing our first-of-its-kind longitudinal analysis of U.S. real estate sustainability trends, coupled with industry leader insights, case studies, and a 2025 outlook. Join the conversation as we explore how the industry is turning sustainability into a strategic advantage.
Download today!
.png)

SWIPE THROUGH FOR A PREVIEW


FOREWARD PREVIEW - PAGE 1


The real estate industry, responsible for 42% of global CO₂ emissions, is at a critical turning point. As economic volatility, evolving regulations, and rising investor expectations reshape the landscape, the industry faces urgent questions:
How much progress toward decarbonization has been made? Is it happening fast enough? What comes next?
To help answer these questions, we’re introducing Measurabl Intelligence—a first-of-its-kind longitudinal analysis offering unprecedented visibility into real estate’s sustainability performance.
This inaugural report leverages meter-to-market data from Measurabl Quantum, the world’s largest real estate sustainability dataset, to track energy use and carbon emissions trends across seven U.S. property types from 2019 to September 2024.
Here's a preview of what we found:

Energy Declines Across Property Types
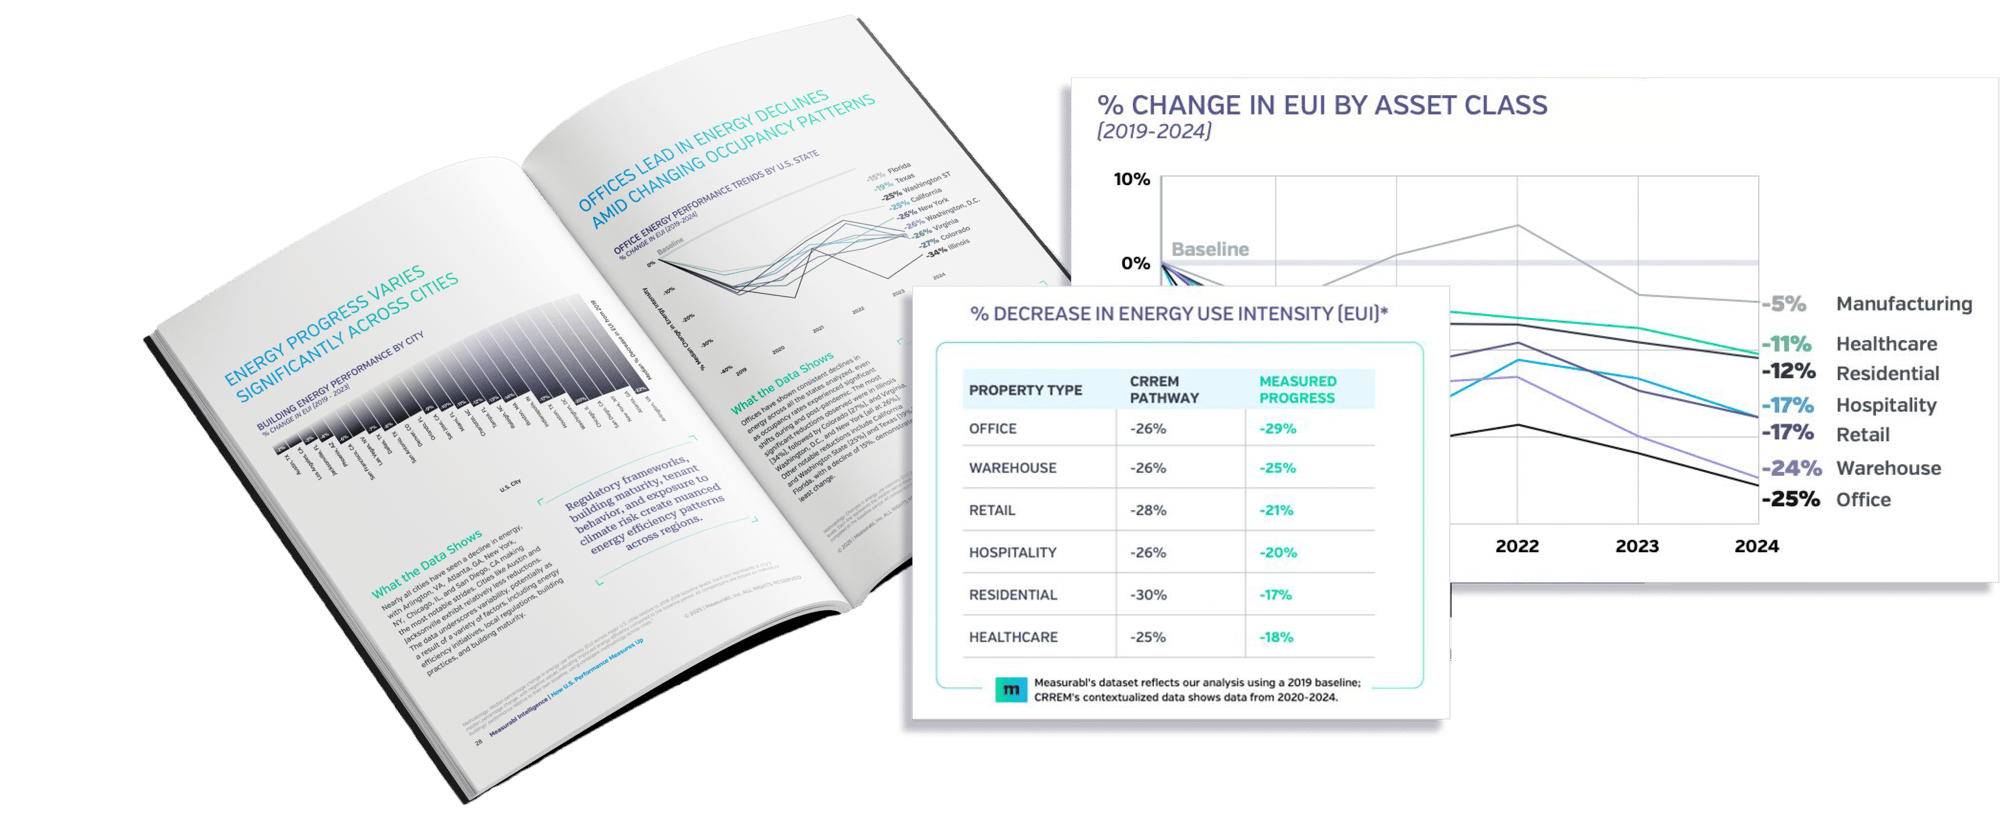
Energy has steadily declined across all seven property types, with offices seeing the steepest cumulative decrease of 25% between 2019 and 2024.

Carbon Trends Outpace Energy Declines
Carbon trends decline even faster than energy usage due to various factors, including the greening of the grid.

State-Level Energy Progress Varies Widely
At the state level, cumulative declines in energy usage range from 14-22%, with some states showing twice as much progress in declines than others.

Local Energy Usage Reflects Extreme Variation
Differences in energy usage at the local level reflect significant variation (2%-22%), indicating some cities have made 10 times greater progress than others, over the same time period.

Office Sector Progress Varies by State
State-level energy reductions are particularly wide ranging in the office sector, where some states saw declines as much as double that of others.
Using meter-to-market data from Measurabl Quantum, this report provides a transparent, objective view of industry progress in the U.S. in the wake of the pandemic. This edition marks the first of a quarterly series that will explore and analyze the trends shaping the future of real estate sustainability.
This report is more than just an overview of trends. It’s a call to action to reframe sustainability as a business strategy—one that reduces costs, enhances asset value, and ensures long-term competitiveness.
Where does your portfolio stack up?

Measurable Progress: The Data Behind the Insights
Our proprietary analysis reveals how U.S. real estate is progressing toward sustainability—highlighting trends in energy use, carbon emissions, and the forces shaping the future.
Key insights include:
✔ Measurable declines in energy use and carbon emissions intensity across 7 major property types
✔ Sector performance—which are leading and which are lagging
✔ What’s driving sustainability—from an evolving policy landscape to grid decarbonization
Download the report to see where the industry stands—and where it’s headed.